
The Geopolitical Crucible: How Strait of Hormuz Tensions Signal a Global Flight to Decentralized Assets
12.07.2026 23:21GPT-5.6 Sol Ultra Solves 50-Year Mathematical Mystery (Graph Theory Breakthrough)
13.07.2026 00:17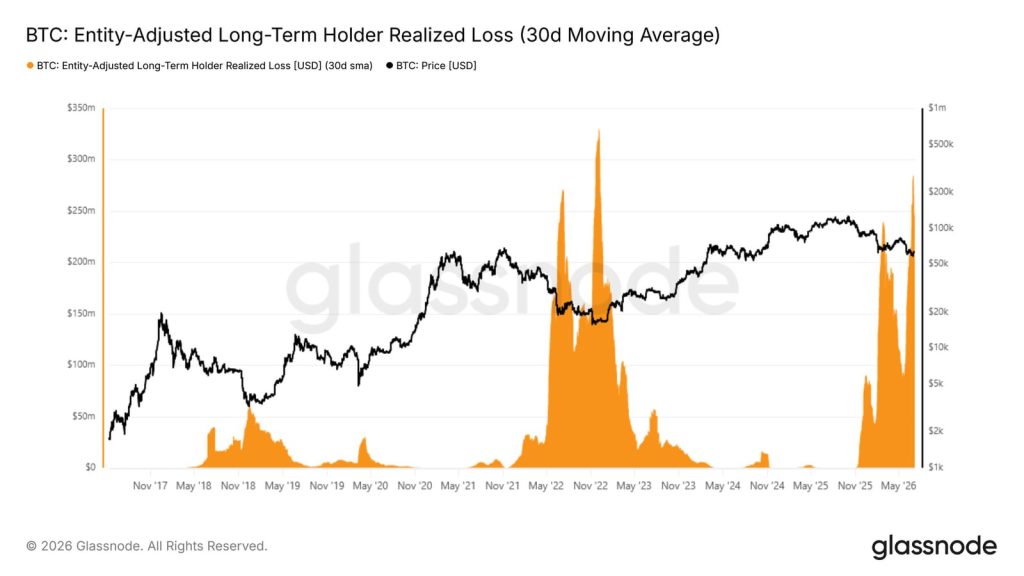
The Market’s Stress Test: Analyzing Bitcoin’s Realized Loss Capitulation Cycle
In the volatile world of cryptocurrency, technical indicators often serve as crucial early warning systems for market sentiment. One such indicator is the 30-day realized loss moving average. Recent data points to a significant peak in this metric—reaching approximately $280 million per day. This represents the second major capitulation signal observed since late 2022, indicating that despite recent price action, underlying selling pressure and unrealized losses remain deeply entrenched.
What is Realized Loss Capitulation?
The realized profit/loss ratio tracks whether traders are realizing gains or losses. When this metric peaks in negative territory (a “capitulation”), it signals that a large number of participants have sold assets at a loss, often driven by panic or forced liquidation. Historically, these capitulation events mark the bottom of a cycle and the start of a potential reversal.
The Significance of the Second Wave
Unlike the first wave of losses which showed signs of cooling, this current downward trajectory suggests that selling pressure is still robust. For Bitcoin (BTC), which has been navigating complex macro environments—from geopolitical tensions to regulatory shifts—this sustained negative momentum means the path to a sustainable bull market remains closed. Traders must view this period not as an immediate danger, but as a critical phase of consolidation and digestion.
Bitcoin’s Resilience Amidst Macro Stress
It is vital for investors to contextualize these technical signals within the broader macroeconomic picture. Bitcoin’s value proposition has increasingly been defined by its non-sovereign nature—a perfect hedge against systemic risks like those posed by global energy crises or unstable fiat currencies. The recent geopolitical tensions, such as those in the Strait of Hormuz, only reinforce this narrative.
Furthermore, institutional capital continues to flow into the digital asset space. Analyzing how major players are positioning themselves is key. For instance, understanding the massive institutional capital flow driving crypto’s new bull cycle provides a counter-narrative to the current capitulation fear.
Key Takeaways for Traders
- Patience is Paramount: The sustained negative realized loss average suggests that market bottoms are not yet in sight.
- Focus on Fundamentals: Instead of chasing short-term price swings, focus on the long-term utility and adoption drivers, such as SpaceX’s infrastructure plays or the increasing role of Web3 in global tech.
- Risk Management: Given the high volatility indicated by these metrics, strict risk management and position sizing are non-negotiable.
📊 Market Data Snapshot (As of Now)
This data provides a real-time view of Bitcoin’s current market standing:
- BTC/USDT Price: $64,148.87 USDT
- 24h Change: -0.26%
Ultimately, while technical indicators like the realized loss average are powerful tools for identifying market stress, they must be interpreted alongside fundamental drivers—be it regulatory clarity (like US Regulatory Clarity Dawns) or massive technological adoption.
🚀 Ready to Navigate Market Volatility?
The crypto market is entering a phase of high technical stress, but the underlying narrative remains one of global transition and institutional acceptance. To manage your risk and participate in the next cycle’s upside potential, explore trading opportunities on MEXC.
🔥 Trade Bitcoin and Explore DeFi Opportunities on MEXC!
🚀 Trade Now via MEXC Referral Link