

🐳 Whale Alert: Massive ETH Transfer to Coinbase and What It Means for Ethereum’s Price Action | MEXC Analysis
07.07.2026 17:39
The Rise of Crypto Compliance: Why AML Checks Are Non-Negotiable for Modern Digital Assets | MEXC Analysis
07.07.2026 19:09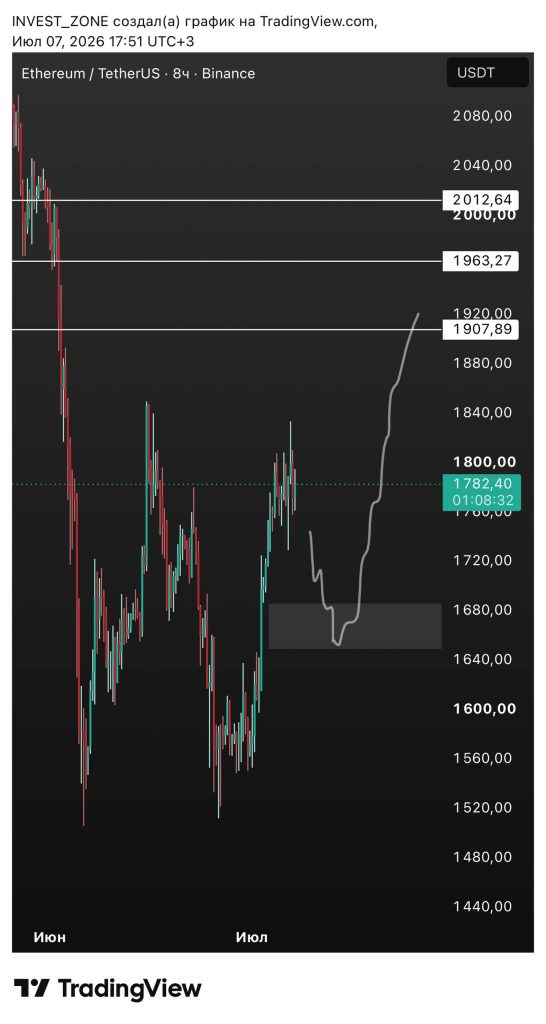
💡 Market Insight: Analyzing Ethereum’s Key Support Levels and Liquidity Dynamics
The cryptocurrency market thrives on technical analysis—the ability to predict future movements by studying past price action. Recent discussions, such as those circulating in Telegram channels, have highlighted critical support levels for Ethereum (ETH), specifically pointing to the **$1650** mark as a potential long entry point. While current prices may be significantly higher, analyzing these key historical and psychological levels is crucial for any serious trader.
The core thesis behind this analysis revolves around two concepts: Support Levels (where buying pressure historically overcomes selling) and Liquidity Clearing (the process of absorbing trapped sell orders).
📈 The Significance of the $1650 ETH Level
When a prominent trader suggests taking long positions at a specific price like $1650, they are identifying what is known as a potential support zone. In technical analysis, support levels act like a floor—a point where enough buyers enter the market to prevent the price from falling further.
The concern regarding “liquidity accumulated below” is highly accurate and reflects advanced trading knowledge. When large amounts of sell orders (sell-side liquidity) pile up at a certain level, it means that if the price drops, those sell orders will be triggered sequentially. For ETH to break through this resistance and move higher, significant buying pressure must first absorb or “clear” that trapped selling volume.
The observation that major capital movers could easily draw the chart toward $2000 highlights the belief in a strong underlying macro trend—a powerful bullish conviction that can overcome temporary technical hurdles. This is not just speculation; it’s an analysis of market structure and institutional intent.
📊 Current Market Reality vs. Technical Targets
It is important to note the current market context. As of today, Ethereum is trading at $1784.88 USDT. This significant gap between the current price and the $1650 target demonstrates how volatile ETH can be, moving rapidly above or below key psychological levels.
The fact that ETH has shown resilience even when facing potential selling pressure (as evidenced by historical analyses of the massive ETH transfer to Coinbase) confirms the underlying strength and institutional interest in the asset.
🧠 Advanced Trading Concepts: Beyond Simple Price Targets
To trade effectively, one must look beyond simple price predictions. Two concepts are paramount:
- Liquidity Pools: Understanding where large amounts of buy or sell orders sit is key. Smart traders don’t just follow the line; they anticipate when and how that liquidity will be consumed.
- Macro Context: Technical levels must always be viewed through a macro lens. The structural strength of ETH, reinforced by deflationary mechanisms (like those seen in Tether’s massive USDT burns), provides the fundamental justification for bullish long-term bets, regardless of short-term dips.
For traders looking to master these complex dynamics and understand how market structure dictates price movement, reviewing The Bearish Signal: Decoding BTC’s Divergence is an excellent educational resource.
🚀 Conclusion & Strategic Takeaways
While specific price targets like $1650 are valuable for short-term analysis, the long-term trend and structural support provided by institutional demand (as seen in BlackRock’s BTC & ETH Accumulation) are what truly define the asset class. The lesson is to combine technical vigilance with a strong understanding of macro fundamentals.
To participate in this highly liquid and technically complex global crypto market, you need access to top-tier exchange services that provide robust tools for risk management: MEXC.